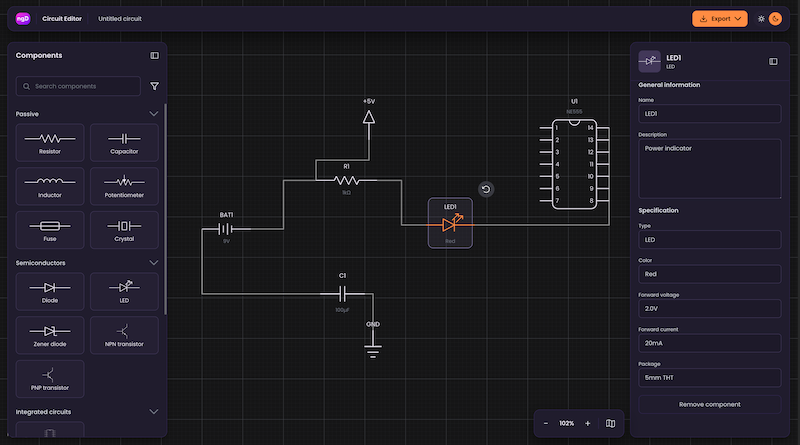
Electric Circuit
Node-based schematic editor with a searchable SVG parts library, smart wire junctions, and SVG, JPEG, or JSON export.
Every node is one of your Angular components, styled with CSS. Every change passes through middleware you control.
ngDiagram is an open-source Angular diagram library for interactive diagrams, node-based editors, and workflow editors – where users model a process, wire up a system, or map an organization. Built for Angular 18 or newer, ngDiagram is developed and maintained by Synergy Codes under the Apache 2.0 license.
Angular templates, signals, dependency injection, and your own forms, rendered as DOM you can inspect.
Your tokens and themes apply from day one – no proprietary styling language.
Validate, modify, or block any update before it reaches the model.
initializeModel gives you a signal-based model; implement ModelAdapter to keep the diagram in your own store.
Copy and paste into an existing Angular app – the same code the quick start guide in the docs walks through.
npm install ng-diagram
In the global stylesheet, not in a component. The library is driven by CSS variables. Without this line the diagram renders unstyled.
/* src/styles.scss */
@import 'ng-diagram/styles.css';
Give the host an explicit height. The diagram fills its container; a container with no height is 0px tall and you see nothing.
import { Component } from '@angular/core';
import { NgDiagramComponent, initializeModel,
provideNgDiagram } from 'ng-diagram';

@Component({
imports: [NgDiagramComponent],
providers: [provideNgDiagram()],
template: `<ng-diagram [model]="model" />`,
styles: `:host { display: flex; height: 300px; }`,
})
export class AppComponent {
model = initializeModel({
  nodes: [
    { id: '1', position: { x: 100, y: 150 },
      data: { label: 'Node 1' } },
    { id: '2', position: { x: 400, y: 150 },
      data: { label: 'Node 2' } },
  ],
  edges: [
    { id: '1', source: '1', sourcePort: 'port-right',
      target: '2', targetPort: 'port-left', data: {} },
  ],
});
}
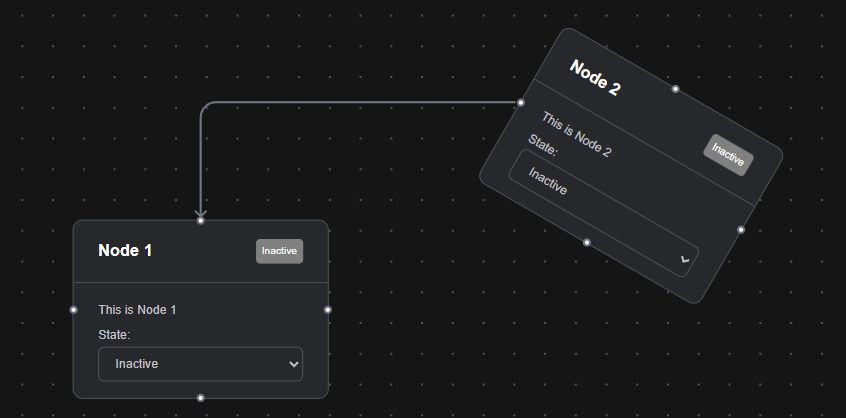
You have a working diagramDraggable nodes, a live edge, and a canvas you can pan and zoom.
Agent skills, an official MCP server, and Markdown docs – so your agent works from the real API instead of guessing at one.
Fork-ready editors, each with a live demo and full source.
Electrical schematics, substation single-line diagrams, AV signal flow, production-line monitoring. The library gives you ports with sides and connection types, floating edges with orthogonal, polyline, or Bézier routing, plus snapping, groups, and a minimap. These templates add SVG symbol libraries, geometry-derived wire junctions, schema-driven properties panels, and SVG or DXF export; the Assembly Line template adds a live data feed with Edit and Monitor modes and threshold-colored KPIs.
Node-based schematic editor with a searchable SVG parts library, smart wire junctions, and SVG, JPEG, or JSON export.
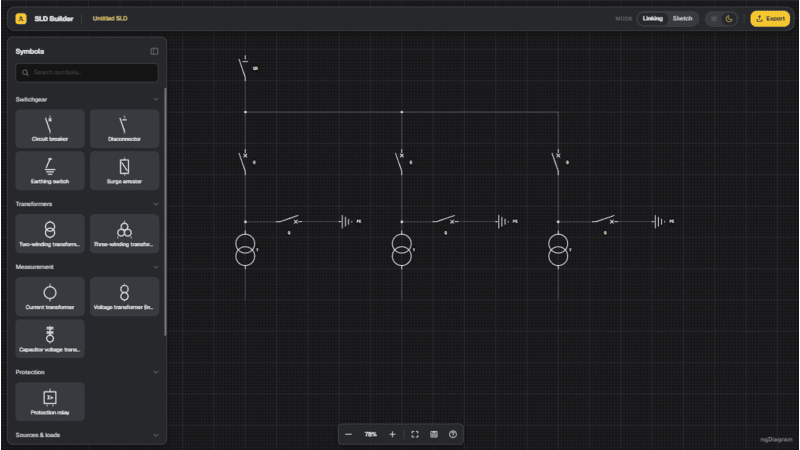
Substation SLD editor with IEC 60617 symbols, geometry-derived junctions, and a schema-driven properties panel.
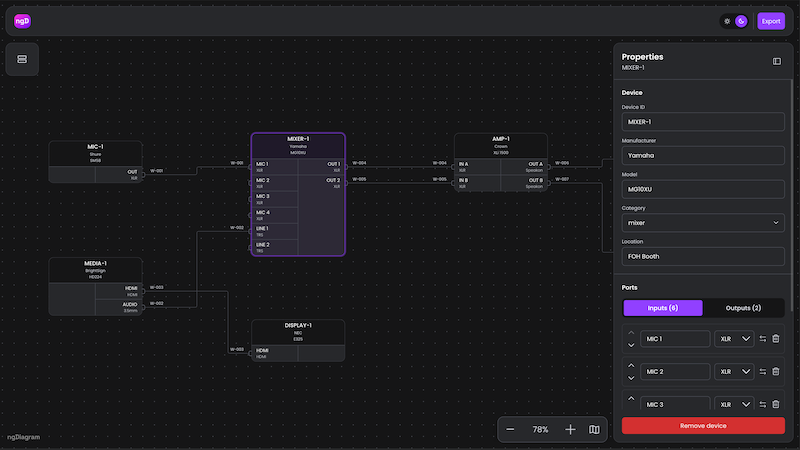
Signal-flow editor with typed connectors (XLR, HDMI, speakON) and PNG or DXF export for AutoCAD.
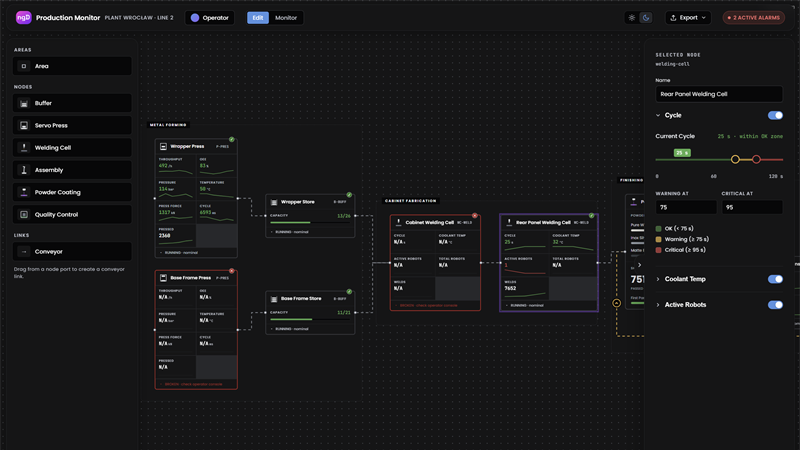
Production-line monitor with Edit and Monitor modes, a live data feed, threshold-colored KPIs, and PNG, SVG, or DXF export.
Org charts, mind maps, BPMN diagrams, hierarchies. The library gives you nested groups, a signal-based model out of the box, a model adapter interface for your own store, plus selection, box selection, and copy and paste. The Org Chart template adds expand/collapse of subtrees and ELK.js layout; the BPMN Editor showcase builds its swimlanes from groups, with a drag-and-drop palette and ELK.js layout in each lane.
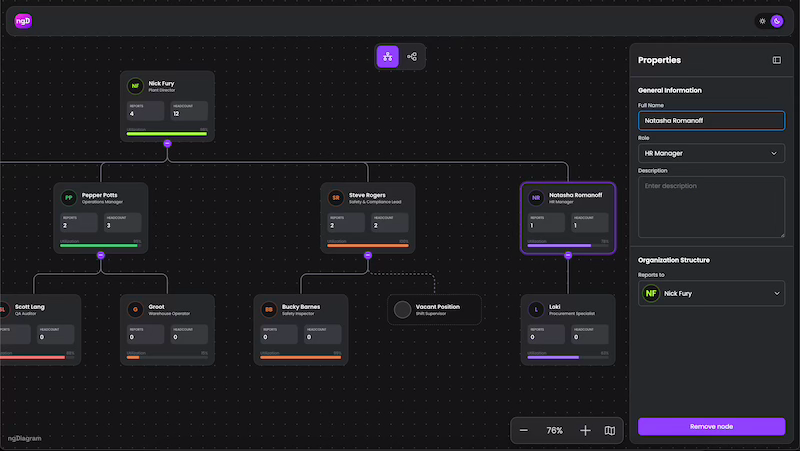
Tree editor with drag-and-drop reordering, expand/collapse, ELK.js layout, minimap, and themes.
Describe the editor you need, and get a tailored version designed and shipped with you.
Ask the ngDiagram teamRunnable Angular diagram examples in the docs – pick the feature you need and start from working code.
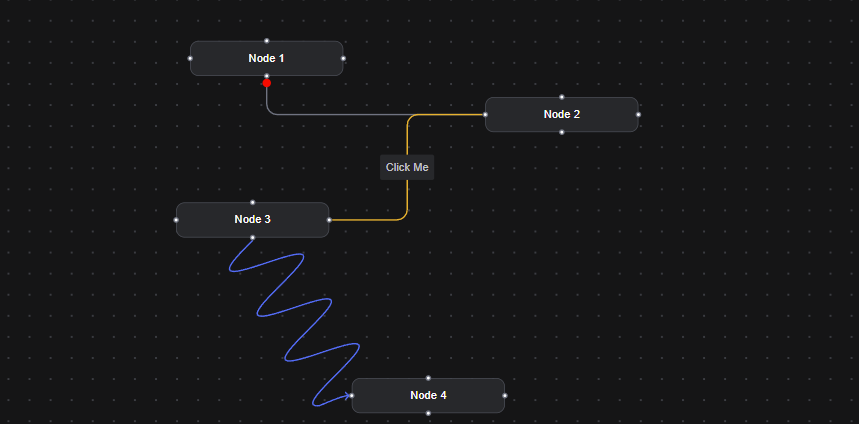
Edges with their own styles and interactive elements, including labels and wave shapes.
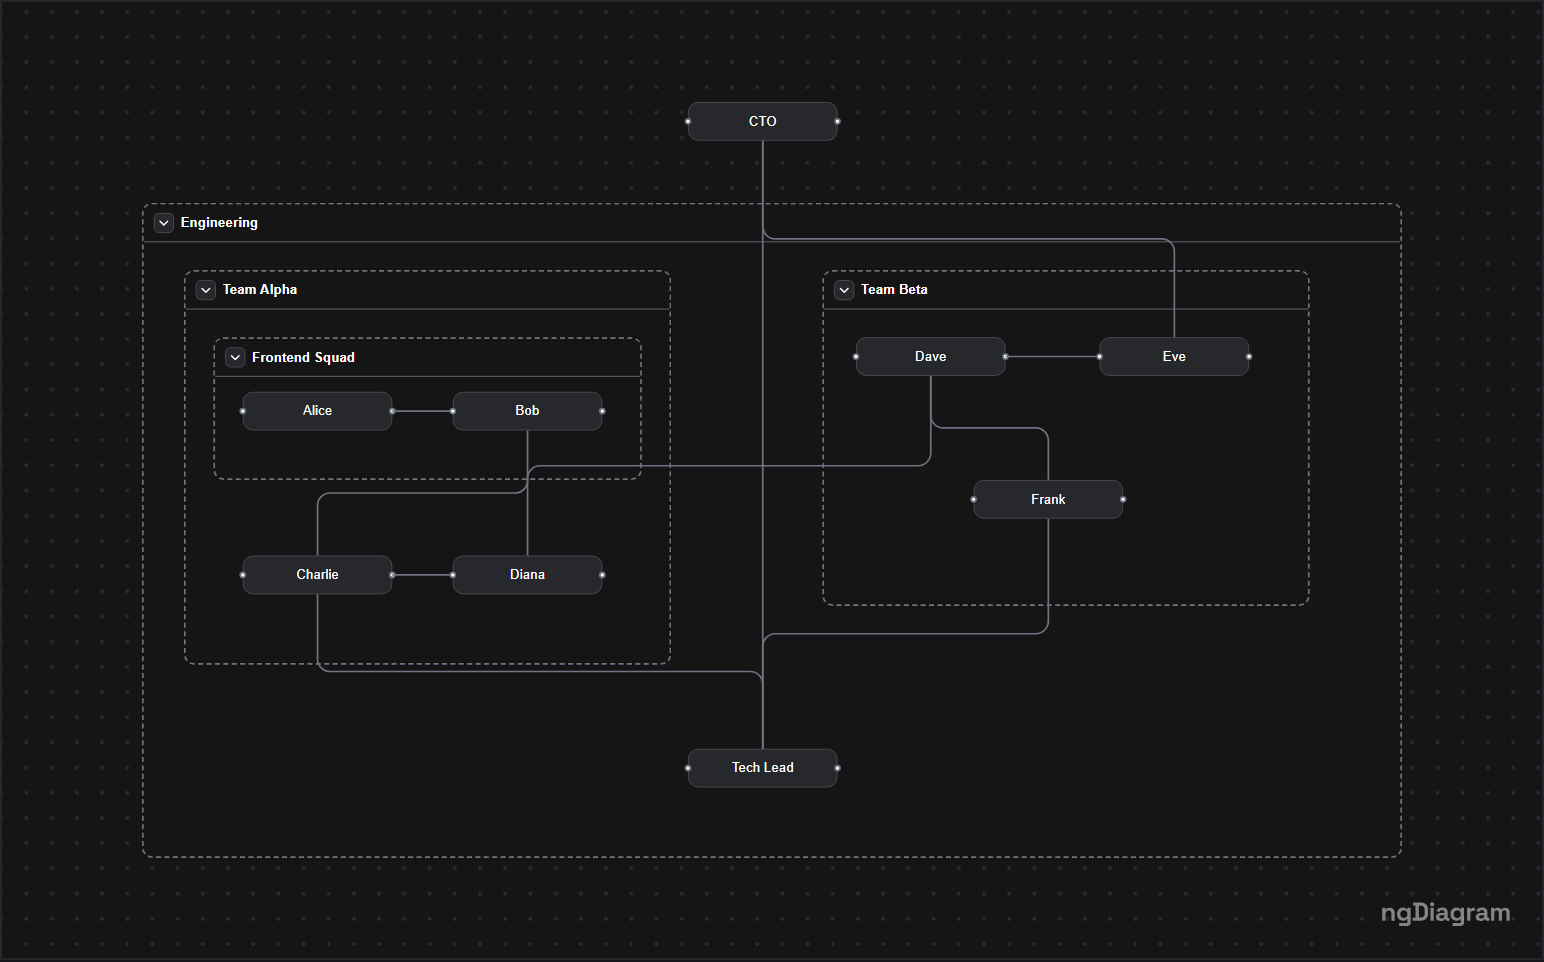
Collapse a group to a header bar; boundary edges reroute so external connections stay visible.
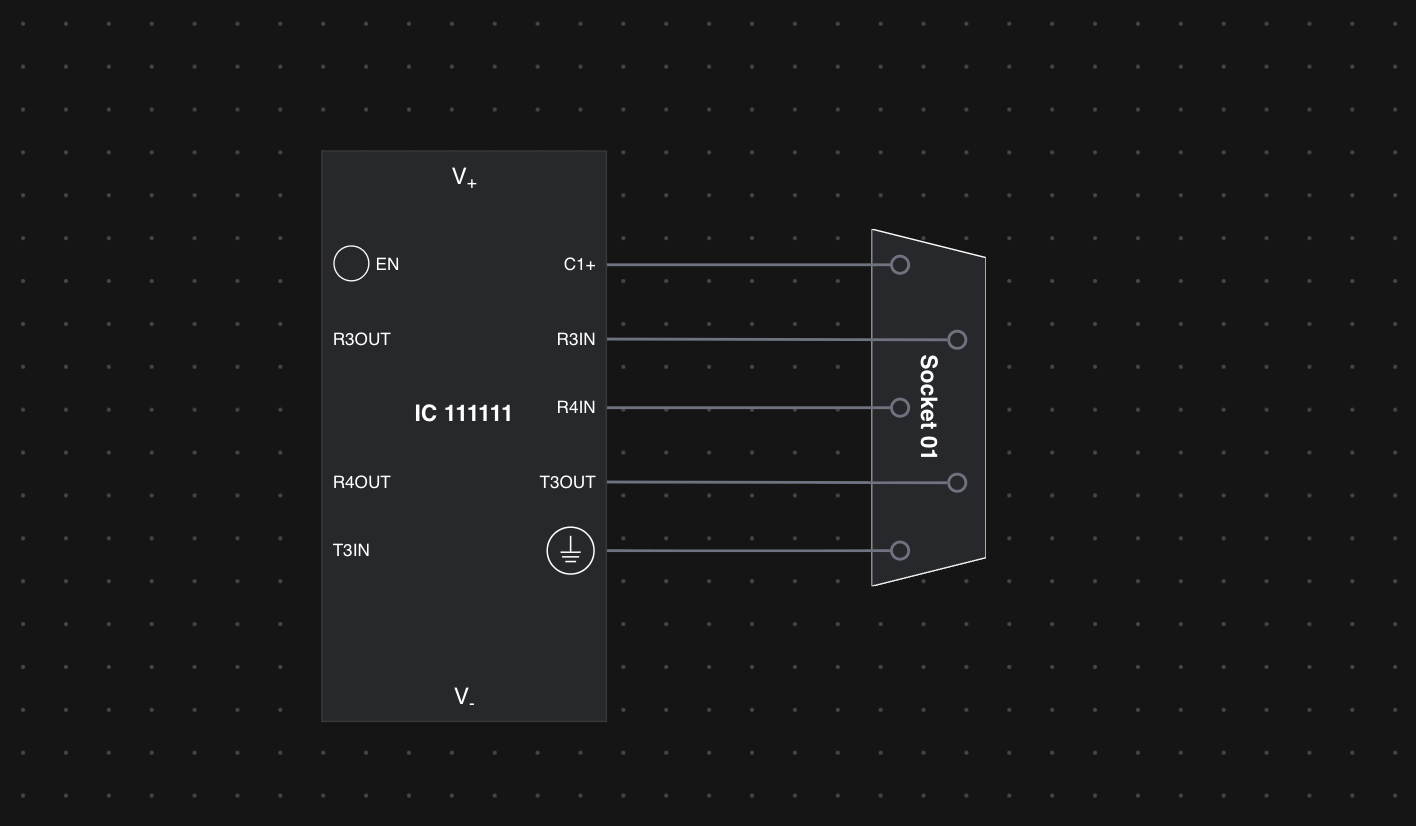
Port appearance, position, and connection types under your control.
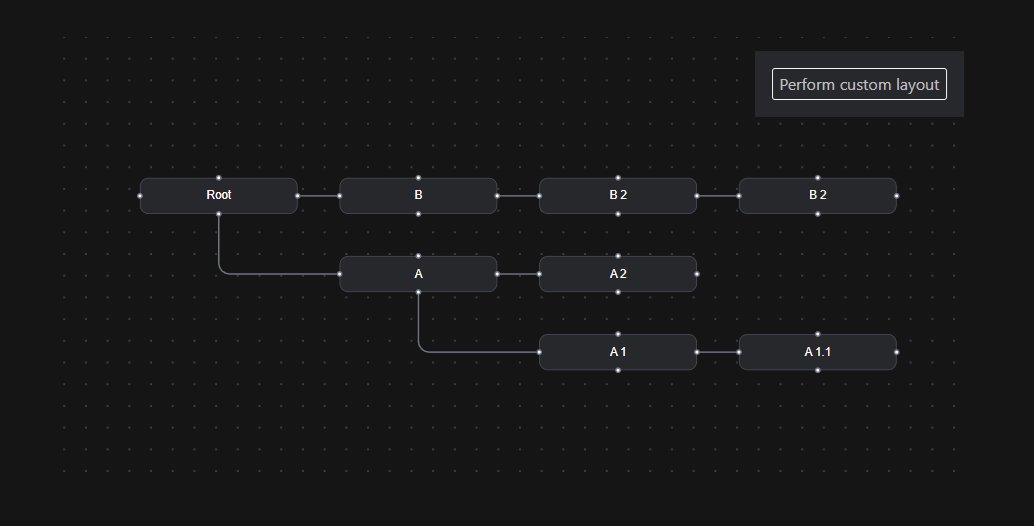
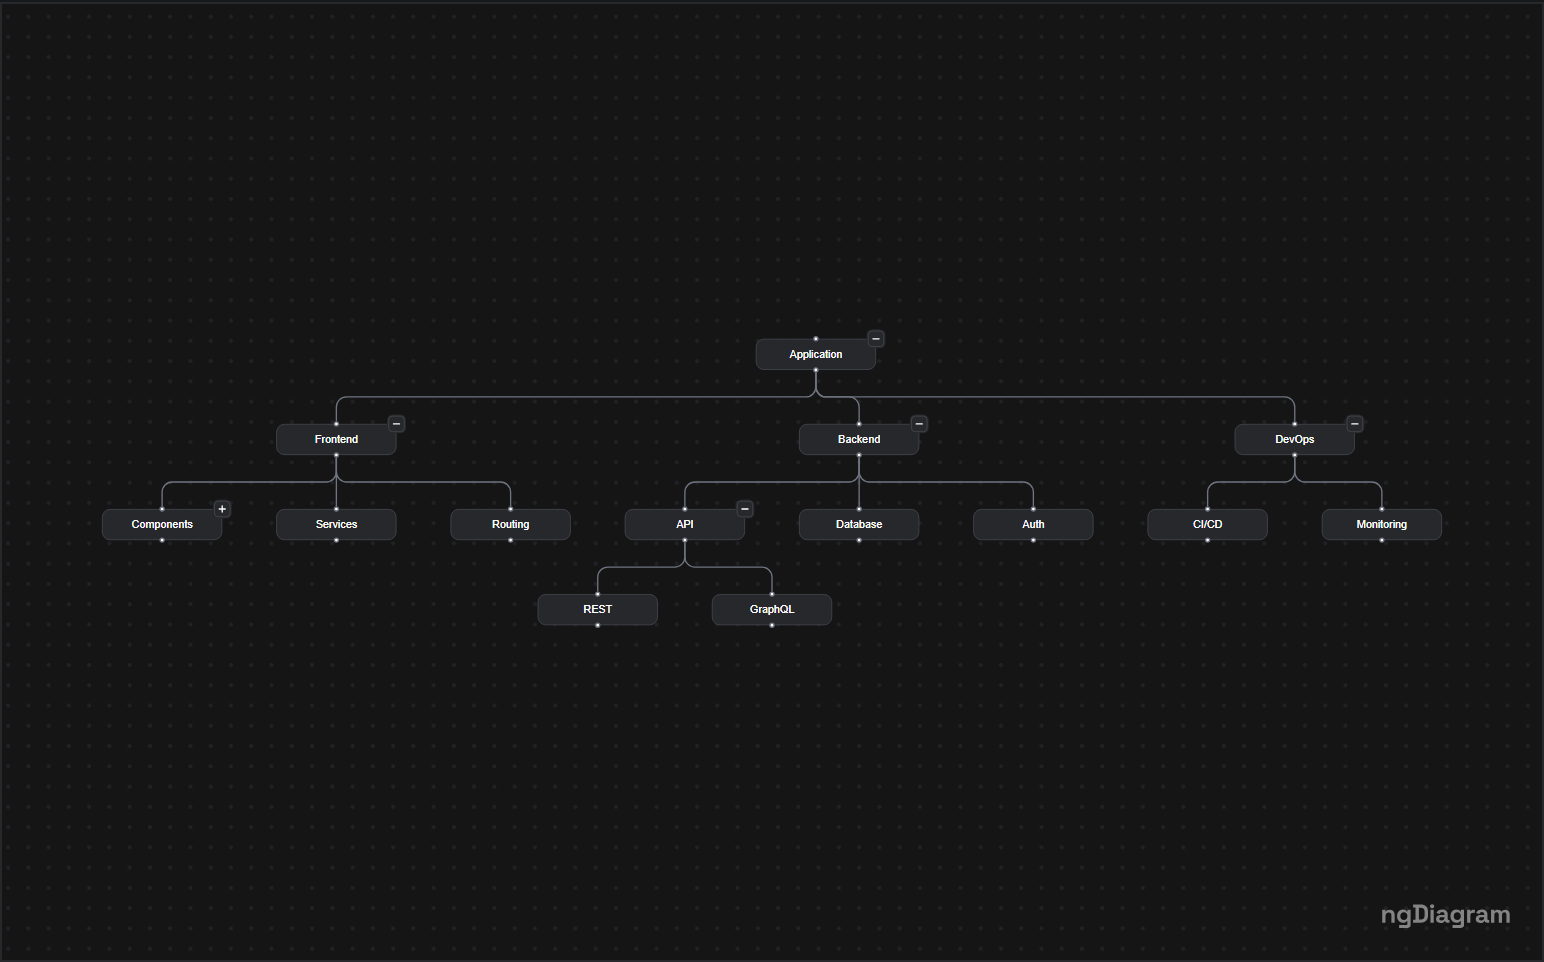
Collapse and expand subtrees, with ELK.js updating the layout of the visible nodes.
Learn how ngDiagram works, build a workflow editor step by step, and see what developers have made with it.
Scaffold an Angular app, install ngDiagram, define a model with nodes and edges, and turn on zoom to fit.
Read the selected node from a service, show its data in a side panel, and write edits back – no subscriptions needed.
Build node templates as plain Angular components, drive ports from node data, and keep edges clean.
Jakub Kubacki and Łukasz Jaźwa on building an Angular-first diagramming engine from scratch, from API design to canvas performance.
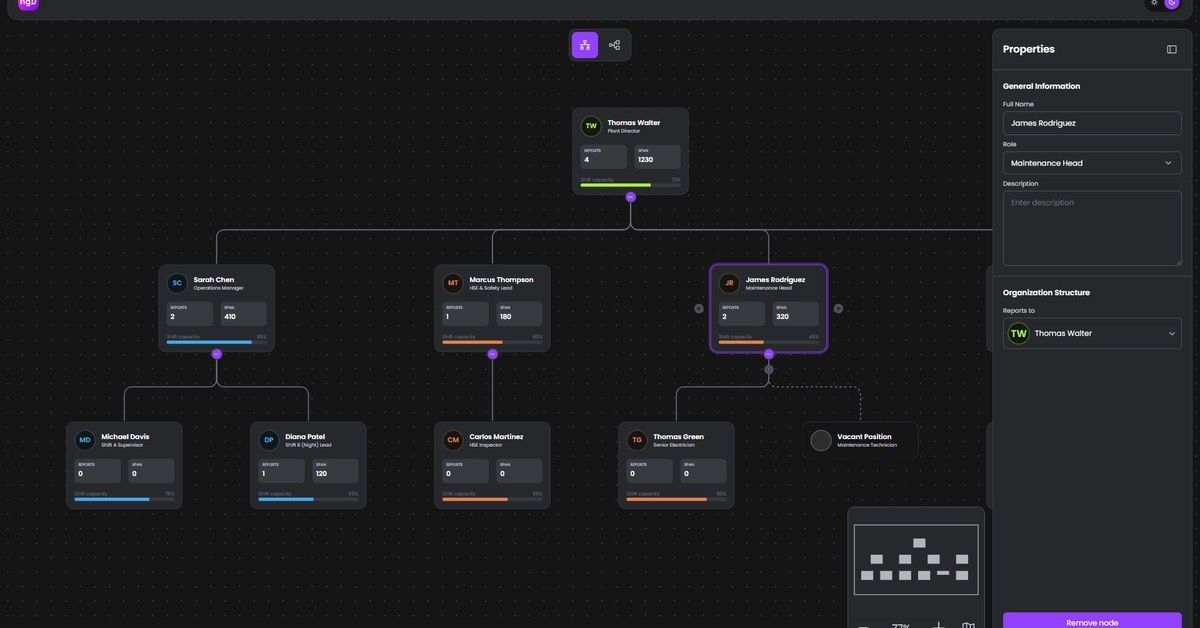
An org chart in 3 weeks: what ngDiagram gives you and what you build yourself.
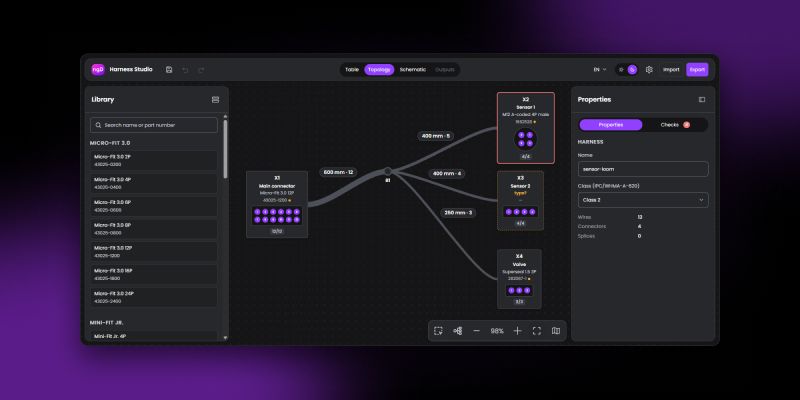
A harness editor built in about 2 weeks on ngDiagram templates and agent skills: Excel import, rule checks, shop files.
ngDiagram is developed and maintained by Synergy Codes (opens in a new tab) – a team with 15+ years of diagramming expertise who:
The same engineers can join your team: onboarding, implementation support, or a complete diagram editor for your domain on a deadline.
Tell us about your project – a schematic editor, a workflow editor, an org chart, or a monitoring canvas. We'll get back to you within 24 hours.
Talk to the teamStarted testing this for work and lost track of time – spent 5 hours just playing around with it. Since it's built for Angular, I think even devs who never touched diagrams before can jump in and connect stuff pretty easily.
 Adam KowalskiSenior Angular Architect
The best thing is it's truly Angular-native. Nodes are just regular Angular components with HTML and CSS, so you stick to what you know – no weird context switching. Makes onboarding way easier and maintenance less painful.
 Emil MałańczakSenior Frontend Developer
ngDiagram gives you more control than other libraries. The middleware lets you override basically anything – try doing that with closed-source tools where you can't even peek under the hood.
 Wojciech KrzesajSoftware Engineer
Ask on Discord – the people who build and use ngDiagram answer there. Bring a question or share what you are building.
Yes. ngDiagram is an open-source Angular diagram library released under the Apache 2.0 license, which lets you use it free of charge, including in commercial projects. The source code is public on GitHub in the synergycodes/ng-diagram repository (opens in a new tab).
ngDiagram works with Angular 18 or newer: the ng-diagram package on npm lists Angular 18 or higher as a peer dependency. The API stability policy in the docs lists the Angular versions ngDiagram supports, and a new Angular major is added within 2 months of its release. Install ngDiagram with npm install ng-diagram and follow the quick start guide in the docs.
Yes. In ngDiagram, a custom node is an Angular component that implements the NgDiagramNodeTemplate interface. You register the component in nodeTemplateMap under a type key, and ngDiagram renders every node of that type with your template. A node template can hold any Angular content, including form controls, images, and buttons.
Yes. ngDiagram gives you the parts of a node-based editor: a drag-and-drop palette, ports, edges with labels, groups, and copy and paste. Every change passes through a middleware pipeline, where your code can inspect, modify, or cancel the change before the model updates. The BPMN Editor in the ngDiagram showcases is a process editor with a drag-and-drop palette and swimlanes built as ngDiagram groups.
Yes. ngDiagram is Angular-first: nodes are Angular components, NgDiagramModelService exposes nodes and edges as signals, and ngDiagram services come through Angular dependency injection. Each diagram gets its own isolated services from provideNgDiagram(), so several independent diagrams can run on one page.
Yes. ngDiagram includes pan and zoom, a minimap with click-and-drag navigation, and box selection. For large graph visualizations, turn on virtualization: ngDiagram then renders only the nodes and edges inside the current viewport. The docs describe virtualization as a performance option for diagrams with hundreds or thousands of elements.
Yes. Synergy Codes develops and maintains ngDiagram and offers consulting for larger implementations. Synergy Codes engineers can help with onboarding and implementation support, or design and ship a domain-specific editor with your team. Describe your project through the ngDiagram contact form.